Walmart Store Sales Forecasting -DS Challenge


There are key points we need to understand while predicting sales.
- It is easier to make forecasts for the near future than for the future 200 days from now. The farther the future , farther we are from being accurate.
- It is good to use multiple techniques for forecasting than just relying on one.
- It is challenging to predict sales when we obtain less historical data. The more the history of sales at hand more we analyze deeper patterns in customer demands.
Business Problem The sales prediction problem was launched by Walmart via Kaggle as a part of its recruitment process to predict the weekly sales for every department of all the stores. We were given historical sales data of 45 stores and 81 departments for every store.
Business Objectives and Constraints
- Robustness Ensuring using Cross validation
- Interpretability As we forecast sales and hand them over to businesses,it is important to answer Why’s? and How’s.
- Accurate prediction matters as it might impact taking business decisions
- No latency requirements (i.e) there is not much demand in predicting sales in milliseconds.
- Models should be Evolutionary as consumer demands/supplies can change over time.
Data Overview Data was collected from the year 2010–2012 for 45 Walmart stores. We are tasked with predicting department-wise sales for each store. We are provided with datasets : Stores.csv,train.csv,test.csv,fetaures.csv
Dataset Size Trainset : 421570 rows (12.2MB) Testset : 115064 rows (2.47MB) Stores: 4KB Features: 580 KB
Understanding the type of Machine Learning Problem that we are dealing with It’s a regression problem where we are given time series(from 05–02–2010 to 26–10–2012) data with multiple categorical and numerical features. We are tasked to predict department-wise sales of each store from 02- 11–2012 to 26–07–2013. In addition, Walmart runs several promotional markdown events throughout the year. These markdowns precede prominent holidays, the four largest of which are the Super Bowl, Labor Day, Thanksgiving, and Christmas. The weeks including these holidays are weighted five times higher in the evaluation than non-holiday weeks. Part of the challenge is modeling the effects of markdowns on these holiday weeks in the absence of complete/ideal historical data.
Away with the theories lets get staright to the Practical work now.
First I imported the libraries

Then I changed the style that allows me to do the plotting. This is specifically useful when it comes to plotting of data.

After that, I went straight into loading the data (stores.csv) to loading the data into the notebook to facilitate manipulation
 After which, I had to display the datasets and then describe them accordingly.
Data Cleaning Data cleansing or data cleaning is the process of detecting and correcting corrupt or inaccurate records from a record set, table, or database and refers to identifying incomplete, incorrect, inaccurate or irrelevant parts of the data and then replacing, modifying, or deleting the dirty or coarse data (Wikipedia)

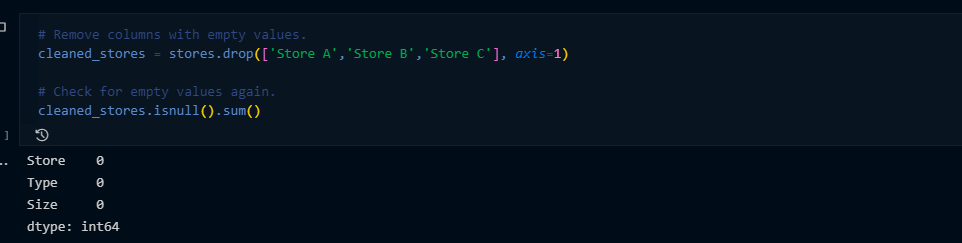
I then removed empty values and re-checked to confirm if there were other empty values
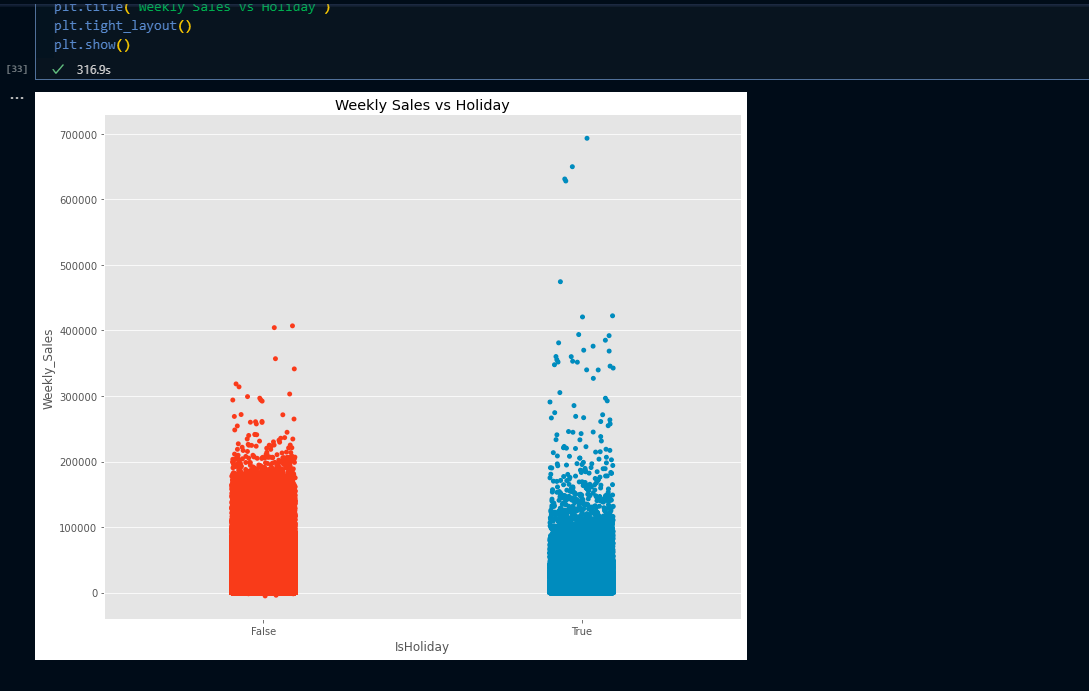
To improve visualization, I then deployed charts. Here, I calculated the maximum size, figures and sizes then build a plot and showed it. This becomes easier especially when one has to do a skimming of the whole dataset which makes it easier.
Plotting the data by Store

Plotting the data by year.